
We constantly look for answers to questions like; What role do online sources play in a person’s journey from consideration to actual purchase? or Why, where, and when do they watch online video? nothing really beats, when we can get true insightful data. We are using Google’s global interactive tool, the Consumer Barometer, which has been updated with 2015 data and now covers so many countries and access to so many insightful market and consumer behavior data.
We are starting a series of VA-DataBoard. Each of this data boards will have answers to a very specific question, Market and consumer behaviour questionnaire with data.
So we inaugurate our series of a blog post by concentrating digital market in India and by understanding which source lead them to purchase decision. (check out the Chart below) to download Indian online Shopping Trends To Watch In 2015 infographic click on the download button.
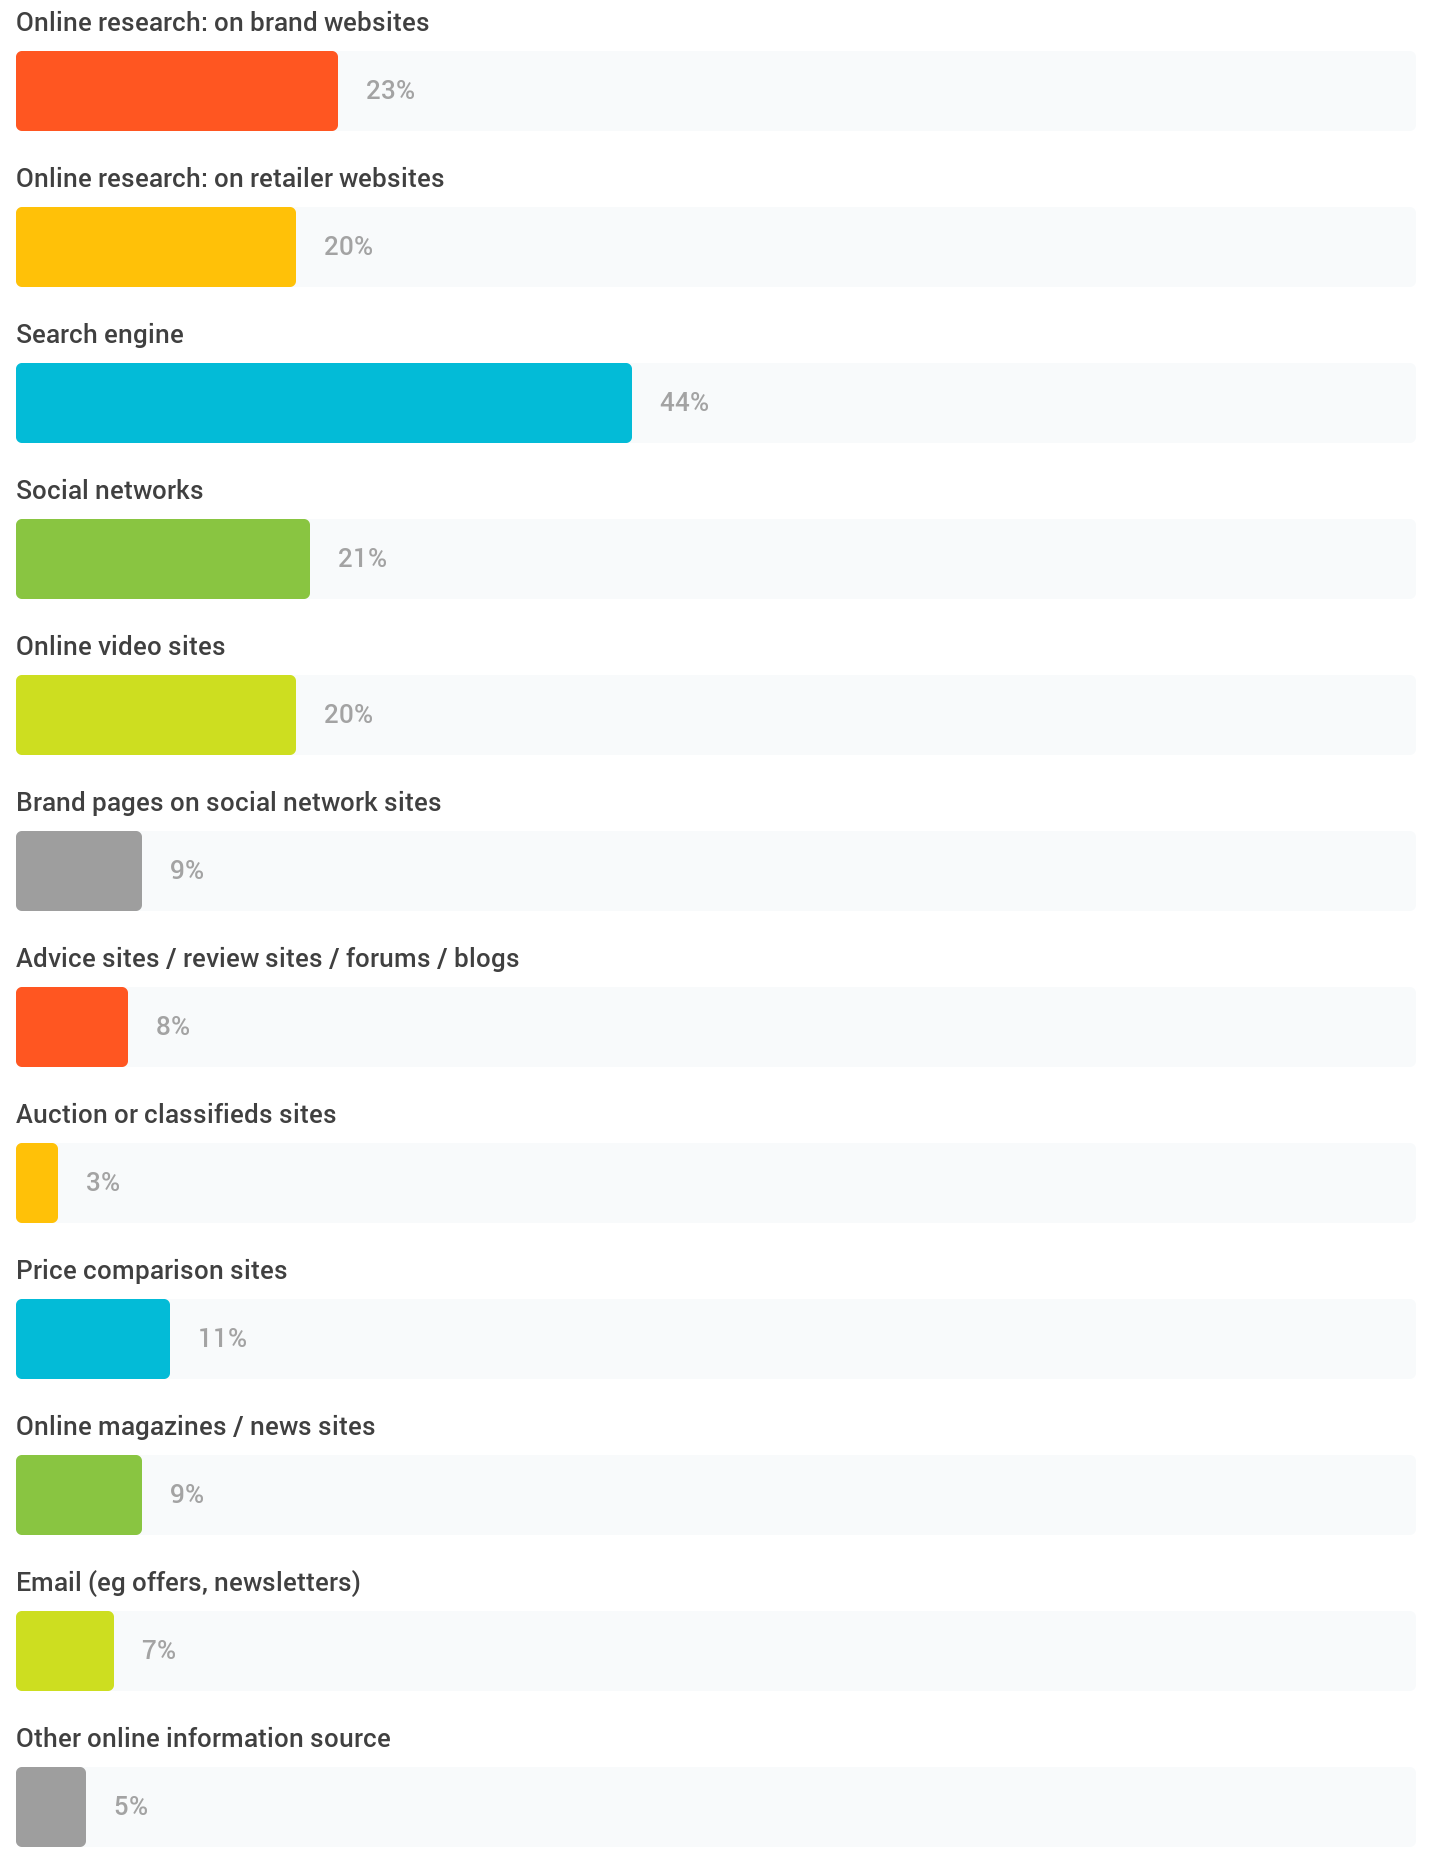
Which of these online sources informed your recent purchase, at any stage from getting initial ideas to reaching a final decision?
Source: The Consumer Barometer Survey 2014 / 2015
Location:India
Total Respondents
According to Consumer barometer, 44% Indian consumers reach to buying decision through search engine results page, a prime online source for research and initial information gathering in their purchase cycle. Indicating Search advertising is reaching individuals where there is intend to buy products and lead them to destination or place to buy.
Online research on brand website is 23%, indicating Indian consumers are loyal to brand’s website for authentic content and prefer as direct source of information, while 21% Indians do their research on retailer’s website where they could compare with other brands or products.
Email campaign or Newsletters are about 7% which may indicate email campaigns are not driving source behind promoting brands or even successful at re-marketing efforts, though percentage here is significantly smaller direct email campaign sometimes do their trick.
But the most interesting media source for us is Online video sites indicating 20%. Youtube in 2013 had globally 1 billion Unique users monthly. Sometime later same year video campaign for digital marketers was introduced as a new platform to reach and grow audience.
Search Engine as a source gave initial Ideas to reaching the
- Cloths & Footwear 51%
- Home Appliances 43%
- Car Insurance 42%
- Groceries 38%
- Groceries 37%
- Real Estate 35%
The above graph indicates product category for which Indian consumers used search for researching before they completed their purchase cycle.
Clothes & Footwear 51% researched on the Search Engine. We see retailer’s, be it of any size, almost everyone is taking advantage of digital media to reach online consumers. The website, apps or simply open your webshop across any e-commerce platforms like Amazon (India) or Flipkart.com. In 2014, we also saw huge seasonal promotion driving seasonal buyers to take advantage of discounts and limited time offer.
Digital marketer’s favourite are weekend sales drive if you realised a sudden bump on weekend promotional SMS or email, this is because a lot of Indians are the weekend shoppers.
Home appliances are 43%, still we see a lot of potential growth in this segment, since updates on google AdWords Business Data, working around a very short period promotional offers was never easy. Now we could place Ads to show only for scheduled time which can be for few hours too.
For the Insurance industry, we are waiting for google Adwords to roll out the special campaign, on which we learned from AdWords performance summit 2015. We are eagerly waiting to get our hands on this new tools. Insurance, Automotive industry and Hotels/Restaurants all three will get a very different ad experiences, so we can anticipate a huge jump in this percentage.
Home furniture segment, this segment itself is very innovative and we see they are engaging in full extend to gain their audience attention. Urban ladder’s app is innovative and engages with their audience; home decoration & pepperfry promotes through youtube channel and traditional Tv Ads.
Groceries are at 37% though we understand this particular segment is lacking reach because of logistic problems. Having said that, we recently learned that Amazon India is planning to introduce groceries as a product category.
Real Estate is around 35%, in india we see so many advancements, innovations which are made to create excellent experiences for their customers. Digital walk through & virtual reality are the game changer, so it digital marketing for this industry. Search or display advertising as the ability to reach people, so we are anticipating increase in this numbers.
Consumer Barometer does share a lot of other industry data, but we picked few from the bunch to analyse.


0 Comments